Hidden Touch Attribution model
A new alternative to Media-mix model
Marketing Attribution is a crucial topic for those companies who need to allocate budget among different marketing channels. Every day billions of dollars are moved between the marketing channels the companies use to advertise their products or services with the aim of increasing sales and/or marketing efficiency.
When customer journeys are not available and/or traditional media are used then the Media-mix model seems to be the only methodology available to perform marketing attribution. But the Hidden Touch Attribution model, which takes inspiration from multi-touch attribution methodologies, offers a new alternative.
1. Attribution methodologies
The first statistical methodology introduced for marketing attribution is the Marketing-Mix or Media-mix model which was introduced at the end of 1940. It is a regression model that takes as input the marketing spending over time of each channel involved in the marketing activity of a company and a target variable represented by the number of sales or by the revenue. Other variables not related to media or external factors can be introduced in the model to improve the model’s accuracy. For an introduction to the Media-mix model, you can refer to this article.
With the advent of browser web cookies, companies started to track users, and a new class of attribution methodologies was introduced at the beginning of 2010. The attention moved towards methodologies that could take advantage of customer journeys. The era of Multi-touch attribution began and logistic regression, Shapley value, and Markov model started to be applied to perform attribution of digital channels. For an introduction to Multi-touch attribution, you can refer to this article.
In recent years, due to privacy restrictions, some browsers started to block third-party cookies. By the end of 2023, Google Chrome which controls 60% of the global web browser market, will block third-party cookies too. The end of third-party cookies could represent the end of the availability of the rich information given by customer journeys. Fortunately, companies have started to move to first-party cookie systems to continue to collect information on users’ journeys. It means that it will not be the death of multi-touch attribution methodologies as some have prophesized but inevitably, cookie restrictions will increase the need for methodologies that can deal with aggregated time series data. Until now, the Media-mix model (MMM) has been the predominant methodology utilized to model this type of data.
2. Introduction to the Hidden Touch Attribution (HTA) model
The HTA model takes inspiration from multi-touch attribution models. Instead of fitting a regression model between the target variable (amount sold or the number of conversions) and the dependent variable (marketing spending on each channel, seasonal effect, etc…), it tries to replicate the generation process of the customer journeys which led to the observed data. The input of the HTA model is:
number of conversions or sales amount observed at each specific time point, usually day or week, or month. The suggestion is to use the most granular level of aggregation available.
the observed traffic on each marketing channel considered
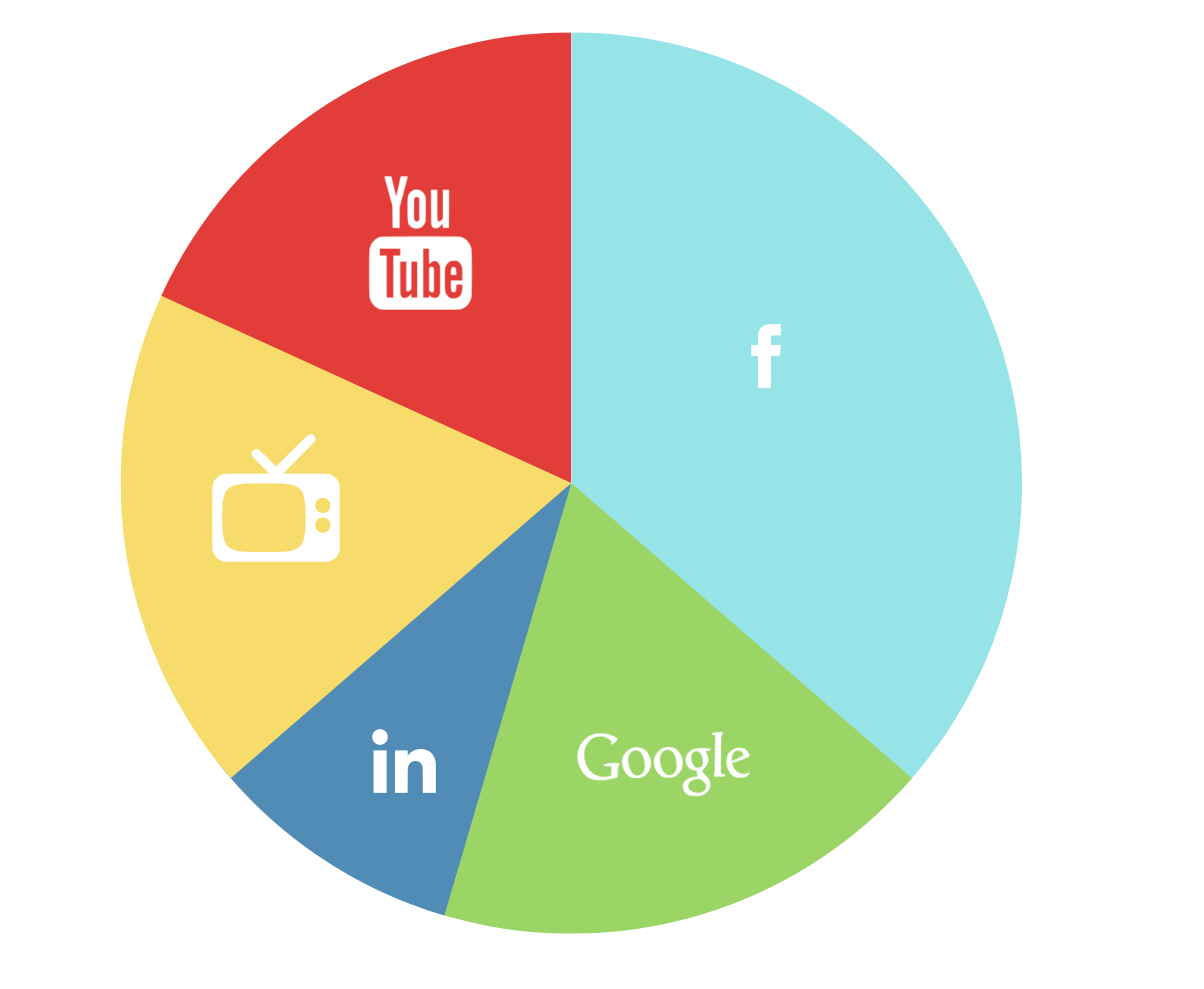
As you can see from the table above, HTA model can manage different kinds of "touch” (impressions and clicks) from digital channels and consider traditional media too.
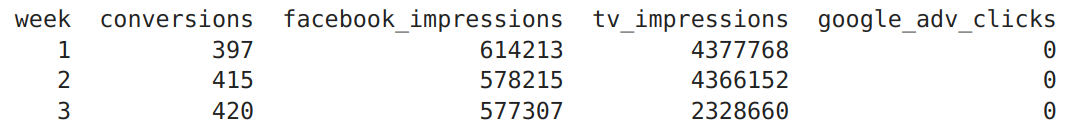
The idea behind the algorithm is quite easy to explain. If we consider the data above, we observed 397 conversions in the first week. We know that each of these conversions is the result of an unknown customer journey. The algorithm tries to replicate the hidden generation process for the customer journeys which led to the observed conversions, using the traffic data available plus a few additional pieces of information dependent on the specific use case. The methodology is thus totally different from the regression approach offered by the Media-mix model.
The advantages of an HTA model over a classical Media-mix model are:
- global conversion rate, if known. It is an optional parameter that can be specified to improve the generation process for the specific use case.
the weights for each channel. They can be specified to give different weights to different kinds of “touch” (i.e. it is common to give a different weight to impressions and clicks).
estimate of the average length of a customer journey for the specific use case.
the adstock rates for each channel. As in Media-mix models, adstock rates can be specified to take into account the different lagged effects of each channel on the target variable.Adstock rates are quite important for traditional channels that usually show a significant lagged effect that could last weeks.
The advantages of an HTA model over a classical Media-mix model are:
perform attribution when only short time series are available. The model can also be applied in an extreme situation when only a one time point is available.
perform attribution in case of sparse observations for one or more involved channels. It is common to observe a lot of zeros on observed data for one or more channels.
estimate of the average length of a customer journey for the specific use case.
perform attribution in case of low variability for one or more involved variables. The regression model does not offer a realistic representation of the dynamic of the variables involved when there isn’t sufficient variability for the distribution of the variables considered.
The disadvantages of an HTA model over a classical Media-mix model are:
if you need to perform attribution on traditional channels too then the estimated number of impressions is required. If you don’t know them a preliminary Media-mix model is needed to perform attribution on traditional channels.
it is not a prediction model. So HTA model can be used only to perform attribution but not to predict the target variable or make scenarios analysis.
3. The algorithm behind the HTA model
This section could be safely skipped if you are not interested in technical details about the algorithm underlying the HTA model.
The three main steps of the algorithm are:
- increase and move traffic between time points
To consider the lagged effect of the channels, the traffic observed for each channel and time point is increased using a Binomial distribution with a mean proportional to the adstock rate of the channel considered and the traffic observed.
To take into account that the observed touches in a specific time instant could refer to a conversion observed in a different time instant, the traffic is moved forward in time using an Exponential distribution with a mean proportional to the estimated average length of a customer journey.
- generate pseudo journey
For each time point, the HTA model does not generate a classical customer journey because it would require information about the transition between channels that are not available and that are difficult to give as prior information. It rather generates a pseudo journey, which only indicates the presence or the absence of a channel in the customer journey. The presence or the absence of a channel in the generated customer journey follows a Bernoulli distribution with a mean proportional to the weight of the channel. The result of a pseudo journey generation process is something like this:
Facebook, TVFacebook, Google Adv
Google Adv
Facebook, TV
…
After we have generated the pseudo journeys, we need to define if each of them converts or not. We use a Bernoulli distribution again, with a mean equal to the global conversion rate.
- attribution with Shapley value
For each time point, the final attribution for each channel of the total conversions or the sales amount observed is performed using Shapley value on the generated pseudo journeys.
Shapley value is chosen as the measure to perform attribution because it is not influenced by the order of the channels into the path and thus can be applied to the pseudo-journeys.
4. HTA model algorithm in practice
Now we want to show how the HTA model can be applied to a real use case. As we showed, the whole estimation process of an HTA model is not so immediate. Fortunately, the machine learning library for marketing attribution ChannelAttribution Pro includes the “hta_model” function that does everything for us.
If you want to know how to install ChannelAttribution Pro you can refer to the official website of the project. ChannelAttribution Pro is available as an R package and a Python library. By filling in a short form you will receive a password to use the library.
We will show all the process step by step in Python. In the end, we will also show the equivalent R code.
After the installation we start loading the library and the data:
from ChannelAttributionPro import *
import pandas as pd
import urllib.request
Data = pd.read_csv("https://app.channelattribution.net/data/Data_ata.csv")
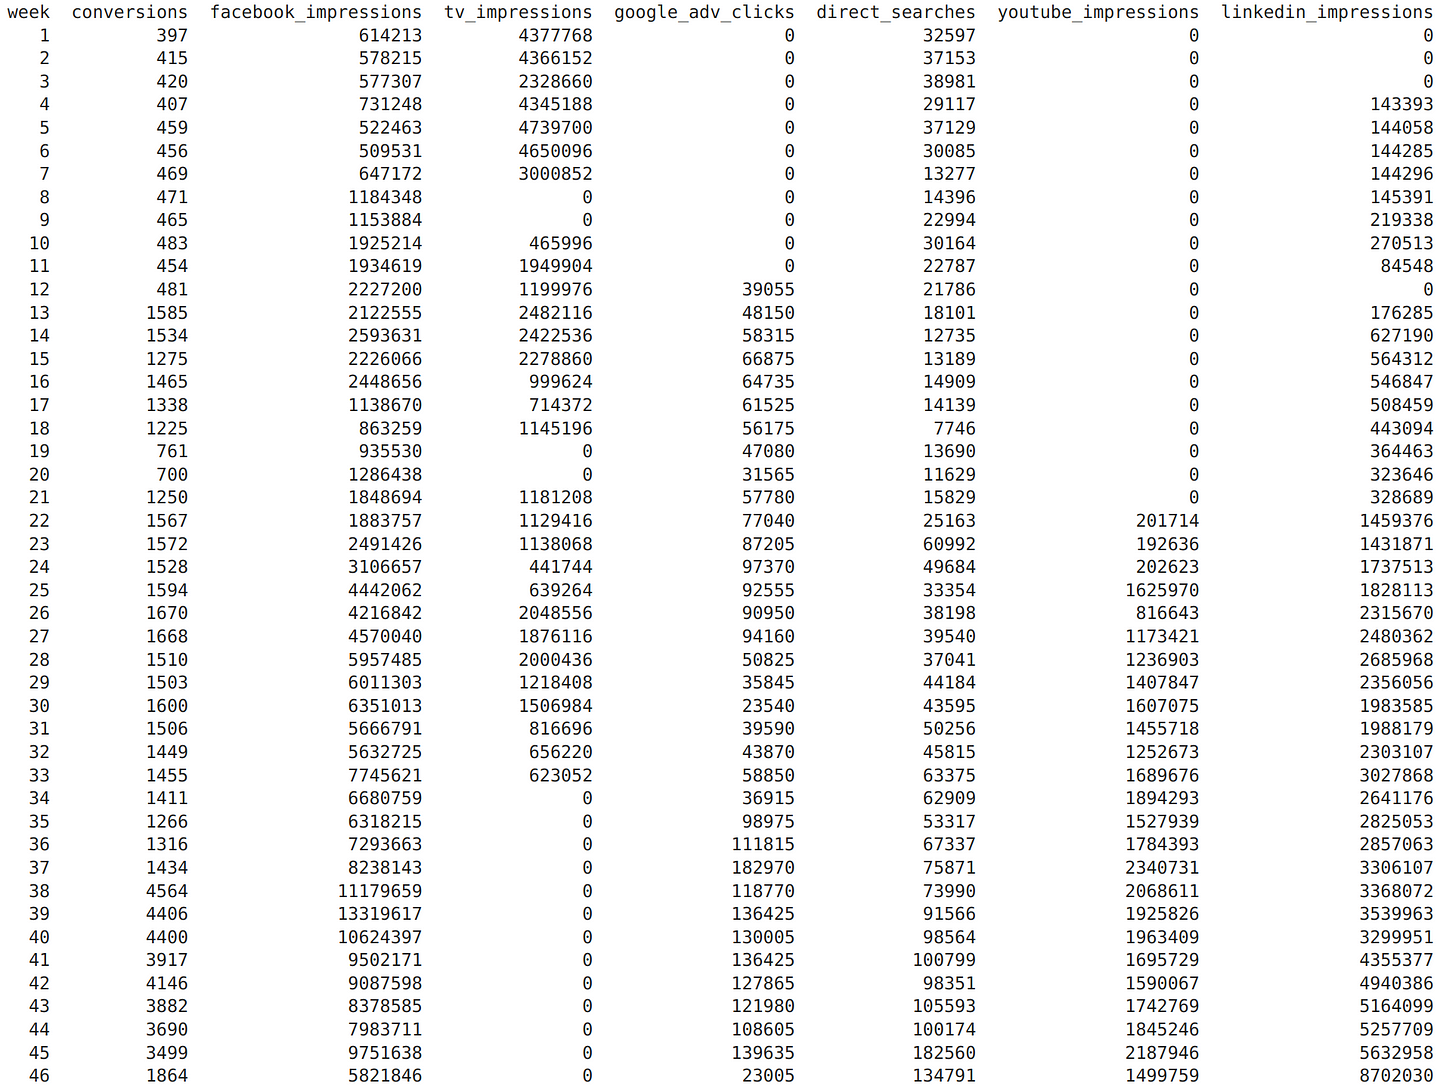
We see we have the number of conversions and the aggregated traffic data for 7 channels over 46 weeks:
The first two parameters we can specify are related to conversion rates:
glob_conv_rate=None
L_conv_rate=None
"glob_conv_rate" is the global conversion rate while “L_conv_rate” is a dictionary where a different conversion rate can be specified for each channel. We set both to None because we have no information about the conversion rates.
Then we can set the channels weights:
L_weight=dict()

L_weight["facebook_impressions"]=0.01
L_weight["tv_impressions"]=0.01
L_weight["google_adv_clicks"]=1
L_weight["direct_searches"]=1
L_weight["youtube_impressions"]=0.01
L_weight["linkedin_impressions"]=0.01
"L_weight" is a dictionary that includes weights for the channel considered. Weights are parameters between 0 and 1 and we suggest setting it to 1 for channels which are expressed as a number of clicks and then setting the weights for the other types of variables according. In our case, we set weights equal to 0.01 for impressions because generally, a click-through rate is near that value. But in specific use cases, a more precise value can be set.
Then we can set the average length of a customer journey:
mean_cj_length=1
In our case, we set the value to 1 which indicates that our customer journeys last 1 unit of time on average. Considering that our unit of time is the week it means that we consider that our customer journeys last 1 week on average. If your data are daily and if you want to set an average length for a customer journey of 1 week, you would have to set the parameter equal to 7.
The last parameter we can set is the list of adstock rates for the channels involved.
L_ads_rate=dict()

L_ads_rate["facebook_impressions"]=0.00
L_ads_rate["tv_impressions"]=0.40
L_ads_rate["google_adv_clicks"]=0.00
L_ads_rate["direct_searches"]=0.00
L_ads_rate["youtube_impressions"]=0.00
L_ads_rate["linkedin_impressions"]=0.00
Adstock rates are quantities between 0 and 1. In our case, we set the adstock rate for "TV" equal to 0.4 which means that for this variable we want to consider a lagged effect that lasts 4–5 weeks while we set "direct search" and "google_adv_clicks" equal to 0.1 which means that we want to consider a lagged effect that lasts about 1 week. The default value for this parameter is 0 which means that no lagged effects are present. For more information about adstock rates you can read here.
Now we are ready to estimate the HTA model:
res=hta_model(
         Data, var_time='week', var_conv='conversions',
         channels=['facebook_impressions','tv_impressions',
         'google_adv_clicks','direct_searches',
         'youtube_impressions','linkedin_impressions'],
         var_value=None,
         glob_conv_rate=glob_conv_rate,
         L_conv_rate=L_conv_rate,
         L_weight=L_weight,
         mean_cj_length=mean_cj_length,
         L_ads_rate=L_ads_rate,
         nsim=1,
         password='mypassword')
To speed up the process we set the number of simulations generated by the process equal to 1 but our suggestion is to use at least the default value of 10 to get more accurate results.
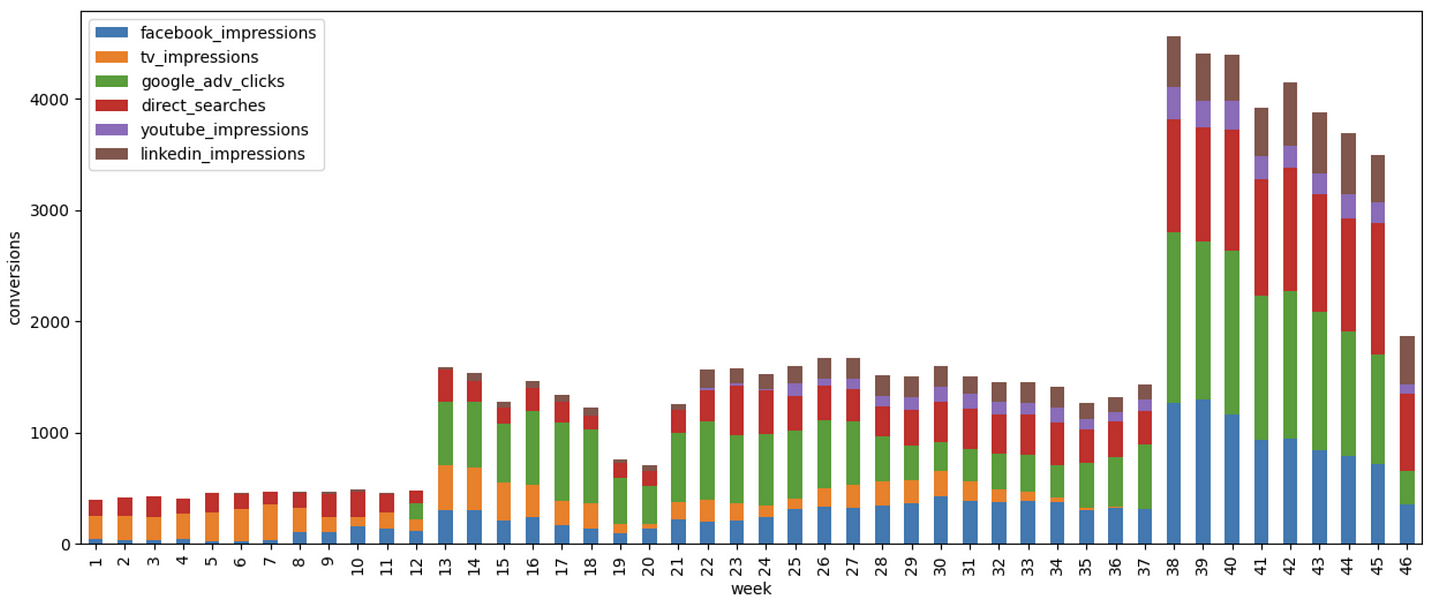
And after the estimation process, we get the attribution results that is the number of conversions attributed to each channel for each week!
  import matplotlib.pyplot as plt
  fig,ax = plt.subplots(figsize=(15,6))
  res.set_index('week',inplace=True)
  res.plot(kind='bar',ax=ax,stacked=True)
  plt.ylabel('conversions')
  plt.show()
The equivalent R code is the following:
#load library
library(ChannelAttributionPro)

#load data
Data=fread('https://app.channelattribution.net/data/Data_ata.csv')

#define the global conversion rate for the use case if known
glob_conv_rate=NULL

#define the conversion rates, one for each channel if known, or NULL otherwise
L_conv_rate=NULL

#define list fo weights (between 0 and 1), one for each channel
#(suggestion: use weight=1 for clicks)
L_weight=list()
L_weight['facebook_impressions']=0.01
L_weight['tv_impressions']=0.01
L_weight['google_adv_clicks']=1
L_weight['direct_searches']=1
L_weight['youtube_impressions']=0.01
L_weight['linkedin_impressions']=0.01

#define the how many units of time are long the customer journeys on average
#for the use case considered
mean_cj_length=1

#define the adstock rates (between 0 and 1), one for each channels
L_ads_rate=list()
L_ads_rate['facebook_impressions']=0.00
L_ads_rate['tv_impressions']=0.40
L_ads_rate['google_adv_clicks']=0.10
L_ads_rate['direct_searches']=0.10
L_ads_rate['youtube_impressions']=0.00
L_ads_rate['linkedin_impressions']=0.00


#run the model
#we set nsim=1 for speed reasons but at least nsim=10 is suggested
res=hta_model(
              Data, var_time='week', var_conv='conversions',
              channels=c('facebook_impressions','tv_impressions',
              'google_adv_clicks','direct_searches',
              'youtube_impressions','linkedin_impressions'),
              var_value=NULL,
              glob_conv_rate=glob_conv_rate,
              L_conv_rate=L_conv_rate,
              L_weight=L_weight,
              mean_cj_length=mean_cj_length,
              L_ads_rate=L_ads_rate,
              nsim=1,password='yourpassword')
5. Conclusion
When no customer journeys are available and/or traditional media are present then the Media-mix model seems to be the only alternative to perform marketing attribution.
We introduced the Hidden Touch Attribution model, a new valid alternative to the Media-mix model because overcomes some Media-mix model limitations.
We showed in a real use case how it is easy to perform attribution with the Hidden Touch Attribution model using ChannelAttribution Pro, a Python library, and an R package for marketing attribution.